During the UK general election campaign, scientists Chris Brierley Professor of Climate Science (UCL Geography) at UCL and Hannah Woodward, PhD Candidate, Natural Sciences, Birkbeck, University of London produced a series of maps with research colleagues, that show both how the climate has changed over the past two generations in each constituency, and how it will change over the next decade.
By providing local climate changes for each respective constituency, the electorate are enabled to ask pertinent questions to election candidates about their plans to tackle climate change in the upcoming and/or future elections.
According to an article written by Brierley for The Conversation, the scientists used combined data from the Met Office and other national weather services to show the extent to which the the UK, like the rest of the world, has warmed since the 1960s. According to the article, the warming is largest in the south-east, with temperatures in for example, Westminster having gone up by a whole degree celsius, averaged across the year.
The maps show:
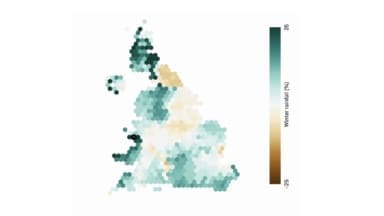
- UK saw one of the wettest winters on record this year, and increasing rainfall in both winter and summer over the past decades
- The temperature of the warmest day of the year, has increased at a faster rate than the annual average, which fits with the increasing heatwaves experienced in recent years.
- Flooding and increases in storm rainfall have increased by 20% – attributed to climate change.
- The amount of rainfall on the five wettest days of the year in a row, show large increases over the Lake District, west Wales and the Scottish Highlands, which have also suffered badly from flooding in recent years.
Future projections
According to the article, the UK is failing to adapt to the changing climate, only making sufficient progress on 6 out of the 61 risks identified in the most recent assessment by the UK Climate Change Committee.
In terms of localised, projected climate changes the scientists modelled date averaged between 2021 and 2040 to compare to the actual weather averaged over 1981-2010. They concluded that for almost every constituency, the models projected 5% – 10% increase in rainfall over winter. In the summer, we are to expect reductions in rainfall, though less dramatic with the average climate over the year projected to warm by 0.75°C throughout most of the UK. The scientists added that the temperature of the hottest day of each year will generally warm by more than that, expected to be worse in inner-city areas due to the impact of the urban heat island effect.
The maps, which can be accessed here are best viewed on a desktop screen.